

Out of thirty thousand products launched every year, 95% fail.
Companies invest 12-20% of their gross revenue in marketing. But top companies have found the secret through product sales analysis. They know success takes more than just putting products on the market.
The best sellers track vital metrics like customer lifetime value, market penetration, and net promoter scores to boost their product sales. They boost their profits by analyzing customer needs, running reward programs, and becoming skilled at upselling techniques.
We created this complete guide to product sales analysis to help you succeed. You'll find the exact metrics, strategies, and frameworks that successful sellers use. These tools help turn data into practical insights and improve sales results.
Understanding Product Sales
It includes everything from identifying potential buyers and presenting your product's value to closing deals and maintaining customer relationships.
Unlike service sales, product sales involves physical items or digital products that customers can purchase and own.
Types of Product Sales Models
B2C Product Sales: High volume, short cycles, conversion-driven
B2B Product Sales: Long cycles, relationship-driven, value-based
SaaS Product Sales: Subscription-based, retention-focused
Enterprise Product Sales: Contract-based, account-driven
Examples of Product Sales
E-commerce: Selling physical products online
A customer buying a pair of noise-canceling headphones directly from a brand’s website or a mobile app.
Retail: In-store product selling
A shopper visiting a local tech boutique to demo and purchase a physical laptop from a sales associate.
SaaS: Selling software subscriptions
A marketing agency paying a monthly fee to access a cloud-based project management tool like Monday.com or Asana.
Enterprise: Selling licensed platforms and systems
A global bank signing a multi-year contract to implement a customized, site-wide Oracle database system across all branches.
EdTech: Selling digital learning products
A university purchasing a campus-wide license for a digital platform like Canvas to host online courses and track student grades.
Manufacturing: Selling industrial products
A construction firm ordering a fleet of custom-fabricated steel beams and heavy machinery directly from an industrial plant.
Product Sales Performance Metrics
Product sales analysis works best when we track three significant metric categories to measure market performance.
Revenue and Profitability Indicators
1. Gross Profit Margin: The gross profit margin is the foundation of financial health and measures the percentage of revenue left after subtracting direct product costs.
Example: If you sell a product for $100 and it costs $60 to make, your gross profit margin is 40%, i.e. (($100 - $60) ÷ $100)
2. Net Revenue Growth: This vital indicator shows your business momentum by measuring the percentage increase in revenue compared to previous periods.
Example: If your revenue grew from $100,000 last month to $120,000 this month, your growth is 20%, i.e. (($120,000 - $100,000) ÷ $100,000)
3. Average Order Value (AOV): This metric reveals your sales effectiveness and customer purchasing power by calculating the typical transaction size.
Example: If your total monthly sales are $50,000 from 100 orders, your AOV is $500, i.e. ($50,000 ÷ 100)
Customer Metrics
1. Customer Lifetime Value (CLV): This crucial metric predicts the total revenue potential from a single customer relationship, helping prioritize customer acquisition and retention efforts.
Example: When a customer spends $100 monthly for 2 years, their CLV reaches $2,400 ($100 × 24 months)
2. Customer Acquisition Cost (CAC): This fundamental metric reveals the efficiency of your marketing and sales efforts by showing how much you invest to gain each new customer.
Example: If you spend $10,000 on marketing to acquire 100 new customers, your CAC is $100 per customer ($10,000 ÷ 100)
3. Customer Retention Rate: This powerful indicator shows your ability to maintain long-term customer relationships and build sustainable revenue streams.
Example: Starting with 100 customers, if 80 continue buying after one year, your retention rate is 80%
{{callout-1}}
Sales Velocity Measurements
1. Average Sales Cycle Length: This critical timeline metric helps optimize your sales process by measuring how quickly you can convert prospects into customers.
Example: A 45-day average from first contact to purchase indicates your typical sales timeline
2. Conversion Rate: This essential performance indicator reveals how effectively your sales process turns potential customers into actual buyers.
Example: Converting 20 customers from 100 leads shows a 20% conversion rate
3. Win Rate: This decisive metric demonstrates your sales team's effectiveness at closing qualified opportunities and predicting potential revenue.
Example: Closing 30 deals from 50 qualified prospects indicates a strong 60% win rate
Building Effective Product Sales Analysis Systems
Sales analysis systems need a well-laid-out approach to data management and evaluation.
Data Collection Methodologies
A complete data collection strategy combines multiple sources to get accurate insights. The first step puts a Customer Relationship Management (CRM) system at the center to track customer interactions and manage sales activities. On top of that, it uses website analytics tools to show customer behavior patterns and page interaction. Customer surveys are direct feedback channels that explain satisfaction levels and product improvement suggestions.
Analysis Framework Development
An effective analysis framework begins with clear objectives and metrics. We focused on daily, weekly, and monthly progress reports to track sales team performance. A well-laid-out framework makes automated reporting possible through CRM integration that saves time and cuts down on errors. This framework helps manage customer relationships smoothly and shows up-to-the-minute data through customized sales dashboards.
Quality Control Measures
Quality control in sales analysis needs clear controls and standard processes. Quality measures include testing at different stages to spot and fix any issues. The quality management system gives audit teams access to check activity quality. This creates a feedback loop that ensures sales agents use suggestions and apply learnings well.
Optimizing Product Sales Through Market Intelligence
Market intelligence serves as the foundation for successful product sales analysis. It provides applicable information about market patterns and consumer behavior.
Market Trend Analysis
Successful trend analysis needs both structured and unstructured data sources. Sales metrics and financial reports represent structured data that focuses on measurable results.
Customer reviews and social media comments make up unstructured data that shows what customers think. Companies that monitor markets continuously can spot unfulfilled customer needs and new market segments. This knowledge helps them make strategic changes to stay ahead of competitors.
Competitor Benchmarking
Your brand's performance needs measurement against these key metrics:
- Market share and growth rates
- Product quality and delivery time
- Affordable pricing strategies
- Customer satisfaction levels
- Revenue growth patterns
This analysis reveals innovative practices worth adopting. Watching competitors and industry leaders helps you adapt to market changes and grab new opportunities. Studies indicate that companies using competitive standards achieve a 16:1 return on investment by reducing costs.
Customer Segmentation Strategies
Customer segmentation needs analytical insights to group your audience based on common traits. This method lets you customize your message and product positioning for each group.
Your strategy should prioritize real customer experiences over basic demographics. Combining post-sale surveys with online reviews makes customer segments more useful and dynamic.
These rich segments lead to better experiences for your entire customer base.
Converting Product Sales Analysis into Action
Companies need systematic, data-driven strategies to turn product sales analysis into real results.
Strategic Decision Making
Data interpretation helps businesses make better decisions. Companies that use data-driven decisions see their deal sizes grow by 30% and win rates improve by 50%. We created a feedback loop where insights shape sales strategies directly.
Sales teams analyze customer behavior, market opportunities, and performance metrics to improve decision-making.
Sales Process Optimization
Clean and accurate data forms the base of sales process improvements. The most effective optimization strategies work well:
- Data segmentation by demographics and buying behavior
- Implementation of explanatory analytics
- Development of immediate visualization tools
- Integration of gamification elements to motivate teams
Companies using these optimization techniques report a 40% increase in EBITDA. Quality control measures ensure data accuracy and consistency that lead to reliable decision-making processes.
Performance Improvement Plans
Performance improvement plans (PIPs) help match individual performance with company goals. A well-laid-out PIP should last 30–90 days with specific, measurable objectives. The data shows successful PIPs boost win rates by 50% for deals at the proposal stage.
PIPs need daily monitoring of leading indicators, weekly structured reviews, and monthly full assessments. This layered method quickly spots areas needing attention while focusing on long-term growth. These plans boost individual performance, strengthen team culture, and lower turnover rates when used correctly.
Overcoming challenges in Product Sales
Differentiate Your Product
Clearly define and communicate your product’s unique value proposition. Emphasize its standout features and benefits to capture customer interest in a crowded market.
To achieve this, you should conduct a thorough market analysis—including SWOT and competitor research—to identify gaps your product can fill. Develop a clear, unique value proposition (UVP) that highlights how your product’s features solve specific customer problems.
For example, if your product offers faster processing speeds or innovative design elements, ensure these benefits are central in your messaging across product demos, website content, and sales materials. Use customer testimonials and case studies to validate your claims and adjust your UVP based on ongoing feedback and market shifts.
Adapt to Changing Customer Behavior
Monitor customer feedback and market trends actively. Adjust your messaging, product features, and sales strategies to meet evolving customer expectations.
To achieve this, establish regular customer feedback loops using surveys, focus groups, and social media monitoring to capture evolving customer preferences. Use these insights to refine your messaging, update product features, and tailor sales strategies.
For instance, implement A/B testing on your website or email campaigns to determine which messages resonate best, then quickly adjust your approach based on the results.
You can also use analytics tools to track market trends and integrate agile product management practices that allow for rapid testing and iteration of new ideas.
Equip Your Sales Team
Provide regular, hands-on training and up-to-date sales materials. Empower your team to handle objections confidently and highlight your product's strengths effectively.
Tools like Superleap come in handy to optimize the sales process. Superleap is a modern AI CRM that lets you build reliable automations capable of handling heaps of data and custom logic.
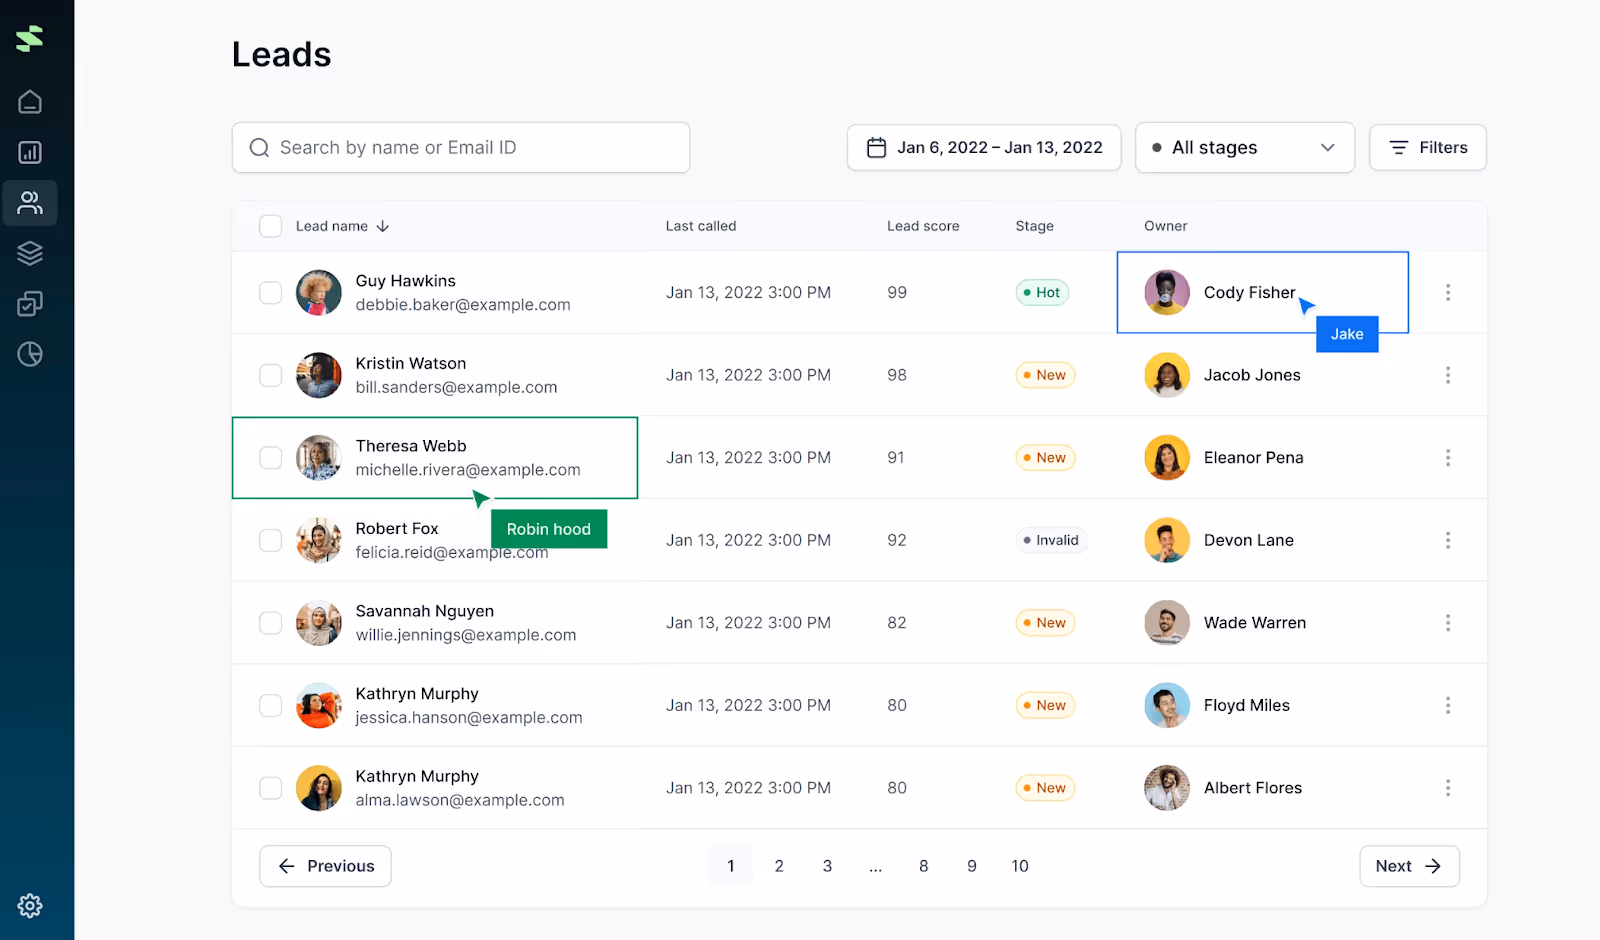
You get smart templates to cover all your sales processes, an AI report builder to create sales reports, and voice analytics to analyze every call, spot mistakes, and train yourself based on data.
Optimize Your Pricing Strategy
Conduct regular competitive analysis and gather customer insights to ensure your pricing remains aligned with market expectations. For example, use pricing software to track competitor rates and apply a value-based pricing model by quantifying the unique benefits your product offers.
Experiment with dynamic pricing and bundling options—such as offering package deals that combine complementary products—to meet various customer needs.
Run A/B tests on pricing structures and bundle configurations to identify which approach maximizes customer satisfaction and profitability.
Kickstart Your Product Sales
Product sales analysis is what sets winning businesses apart from the 95% of products that fail each year. By tracking key metrics like customer lifetime value, acquisition costs, and sales velocity—and keeping your data clean—you can make smarter, more informed decisions.
Benchmark your performance against industry standards, and then use those insights to fine-tune your sales processes. This approach can lead to bigger deals, higher win rates, and stronger revenue growth.
On top of this, invest in reliable data systems to stay on top of market trends and take decisive action. When you do so, you'll be joining the ranks of top-performing sellers who know how to turn insights into real results.
Companies that generate an average of 72% of their revenue from existing customers show strong profitability through customer retention.


.svg)
.svg)
.svg)
.svg)